
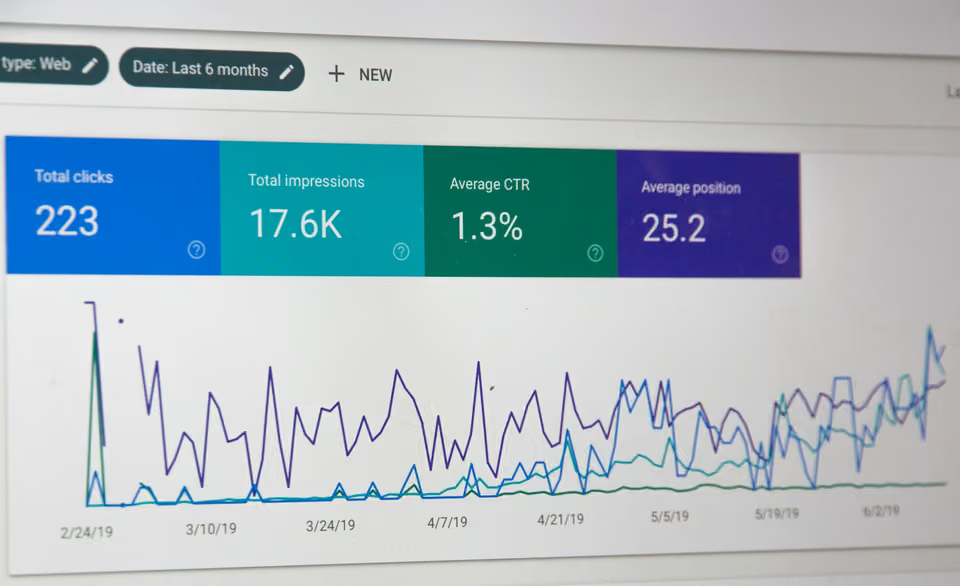
Database and Dashboard Solutions
Get out of spreadsheet hell
Overview
How it works for your business.
Spreadsheets are great until they aren't. Formulas break, versions multiply, and at some point nobody's sure whose copy has the right numbers. We replace that with a proper database and live dashboards your whole team trusts. Live KPIs with role-based access so people see what's relevant to them. Automated alerts when a metric moves. You stop waiting for the weekly report and start making decisions on what's actually happening today.
Key benefits
Bring the Numbers Together
Combine agreed data sources into a shared view, with definitions your team can discuss. We also plan how to handle gaps or differences between systems.
Know When Data Was Updated
Dashboard refresh schedules are set around your data sources and reporting needs. We discuss how to make the age of the information visible to your team.
Put Useful Information in Reach
Shape reports around the questions your team needs to answer, with filters and views planned for the people using them.
Our approach
How we solve the hard problems.

How we map your data
We audit every spreadsheet, database, and silo you've got. We trace where each number comes from and where the inconsistencies start. Most reporting headaches come from the same root cause: nobody's sure where the source of truth lives.

How we design the database
We design the schema for what you need now and what you'll need at 10x the volume. Proper structure and indexing means the database stays fast and reliable whether you've got a thousand rows or ten million.

How we design the dashboards
A dashboard nobody looks at is useless. We design around the decisions your team makes day-to-day, surfacing the right numbers at the right level of detail for the role. Execs see direction, operators see what they need to act on.

How we add intelligent alerts
Beyond just showing data, we set up alerts that ping you when a metric crosses a threshold or trends weird. The dashboard isn't passive. It tells you when something needs attention before you have to go looking.
What's included
- Custom database design and build
- Live reporting dashboards
- KPI tracking and alerting
- Role-based access control
- Data migration from existing systems
Common use cases
- Sales performance dashboards
- Inventory tracking systems
- Financial reporting
- Customer analytics
- Operational metrics monitoring
Our process
From discovery to delivery.
Data audit
We inventory your spreadsheets, sources, and reports to figure out what's worth keeping and what's just noise.
Schema design
We design a clean database schema so your data is fast to query and reliable to trust.
Migration and build
We move the existing data over, build the dashboards, and wire up the automated reports and alerts.
Train and hand off
We train your team to use the dashboards so they can answer their own questions instead of asking you.
Explore more
Other services you might need.



Ready to start?